|
All 5 books, Edward Tufte paperback $180
All 5 clothbound books, autographed by ET $280
Visual Display of Quantitative Information
Envisioning Information
Visual Explanations
Beautiful Evidence
Seeing With Fresh Eyes
catalog + shopping cart
|
Edward Tufte e-books Immediate download to any computer: Visual and Statistical Thinking $5
The Cognitive Style of Powerpoint $5
Seeing Around + Feynman Diagrams $5
Data Analysis for Politics and Policy $9
catalog + shopping cart
New ET Book
Seeing with Fresh Eyes:
catalog + shopping cart
Meaning, Space, Data, Truth |
Analyzing/Presenting Data/Information All 5 books + 4-hour ET online video course, keyed to the 5 books. |


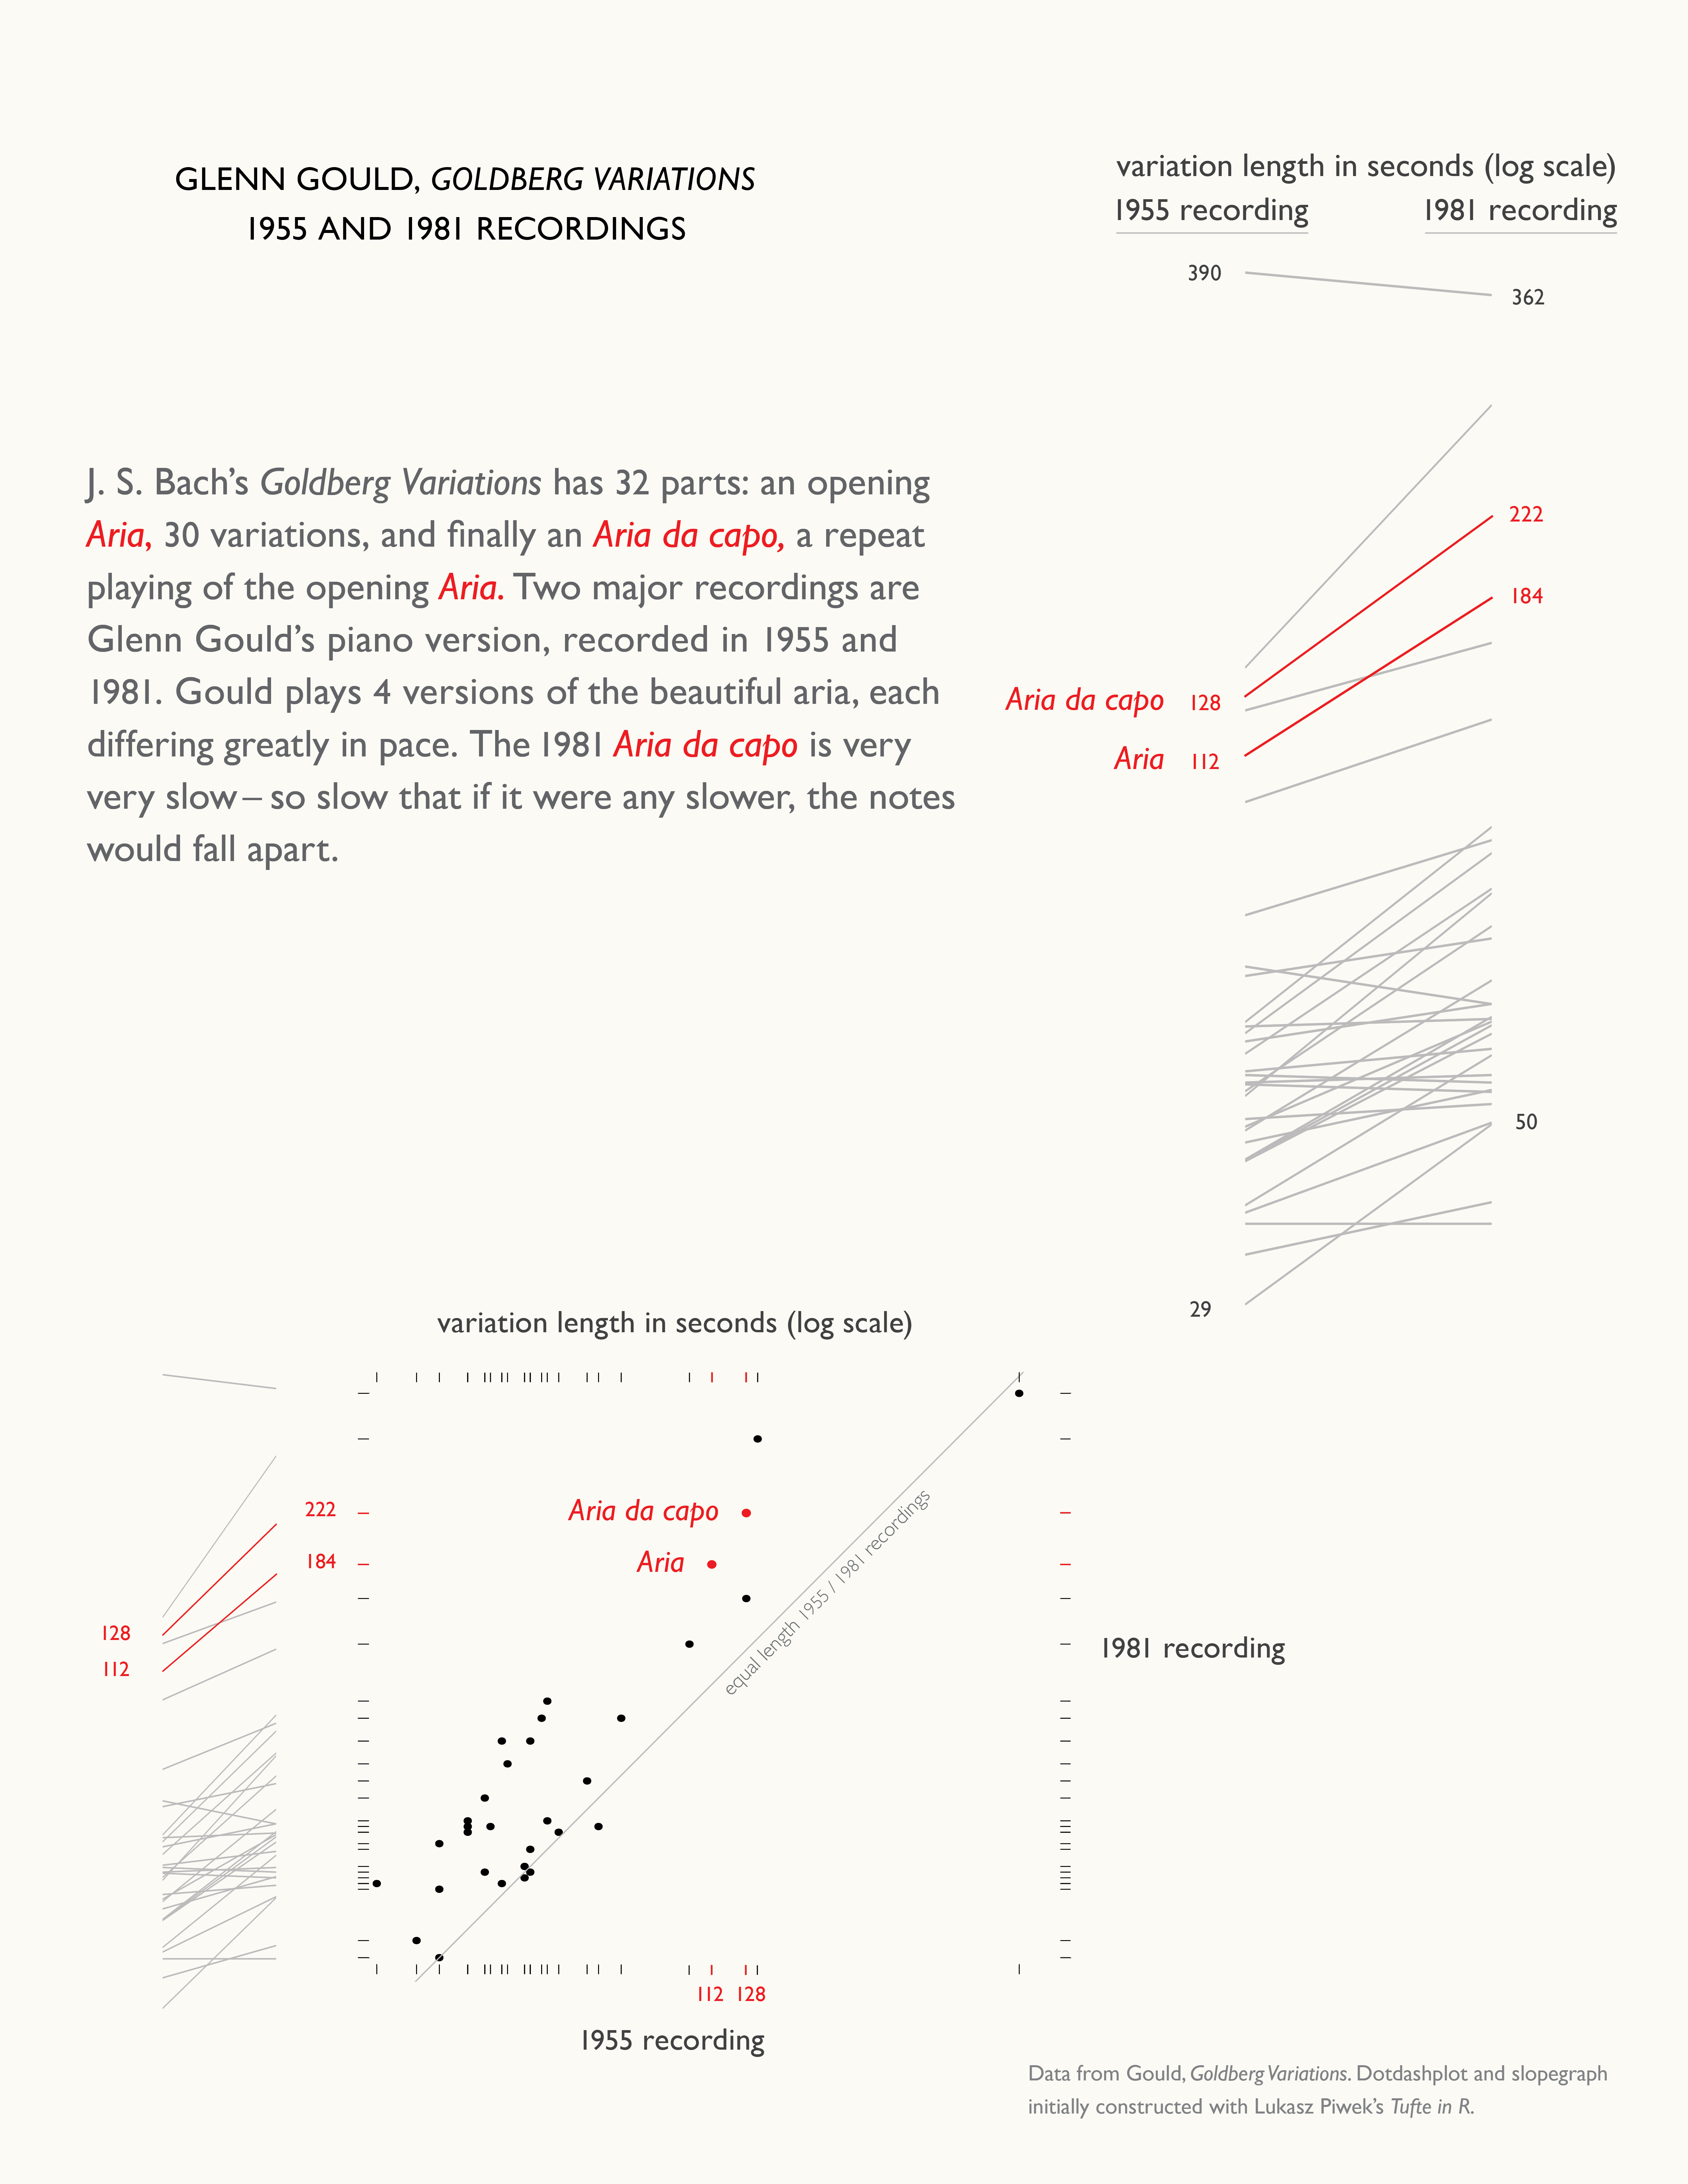
Initial graphs (slopegraphs and dotdashplots)
constructed in R with Lukas Piwek's Tufte in R,
then edited in InDesign.

-- ET
I believe the "dashplot and slopegraph" diagram has the leftmost of the two red "ticks" on the bottom (labeled "1955 Recording") assigned to the wrong color. And, therefore, black "tick" to the right of the red one also. (Please see the top tick bar for comparison.)
-- Ted Hajduk (email)
Excellent catch. The dot-dash-plot above has since been corrected.
Here's what happened:
While there is an individual dot for each data point, some of the dashes here represent multiple data points. Because we're plotting the variation lengths on a logarithmic scale, this happens not only when the variations have the same length in seconds (for example, in the 1955 recording variations 2, 5, 9 are all 37 seconds long), but also when the rounded logs are the same. You can see here that there are three times a pair of data points have been collapsed into a single dash, thus throwing us off a bit when adding the red highlight.

This is a good point to note when comparing the relative merits of the different chart types as implemented by Lukasz Piwek's Tufte in R. While each data point is represented by the slopegraphs and by the dots of the dot-dash-plot, the dashes of the dot-dash-plot don't represent the repeated values.
-- Emily